Using Avogadro as a GUI
The Avogadro software is a free GUI that can be use to set up you geometries and even analyze ORCA outputs, and the ORCA team has developed their own version that can be downloaded from the ORCA forum. There you can find a windows installer, that can be used also by Linux users with Wine.
Drawing molecules
After opening the program, you will see its main main screen:
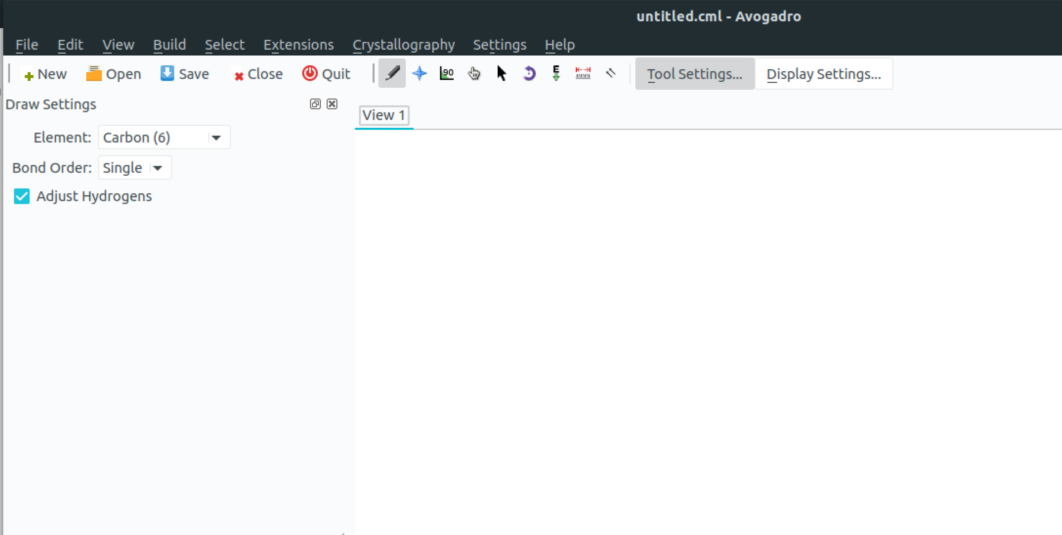
Using the pencil tool, you can draw you molecule using the left click to create and right click to delete atoms.
The atom type is selected under "Element" and the "Adjust hydrogens" can automatically fix the valence of you molecule.
The blue star can be used to rotate the molecule and the glove to move atoms.
After drawing you guess structure, click on the "E" tool (the one with the green arrow poiting downwards) and then "Start" to run a simple molecular mechanics optimization.
You can save you geometry as a .xyz file or directly use Control+C to copy the xyz data and paste it on a text editor.
Creating inputs
After drawing a molecule, you can use Avogadro to make simple ORCA inputs. Click on "Extensions", select "Orca" and "Generate Orca Inputs..." to open a new window:
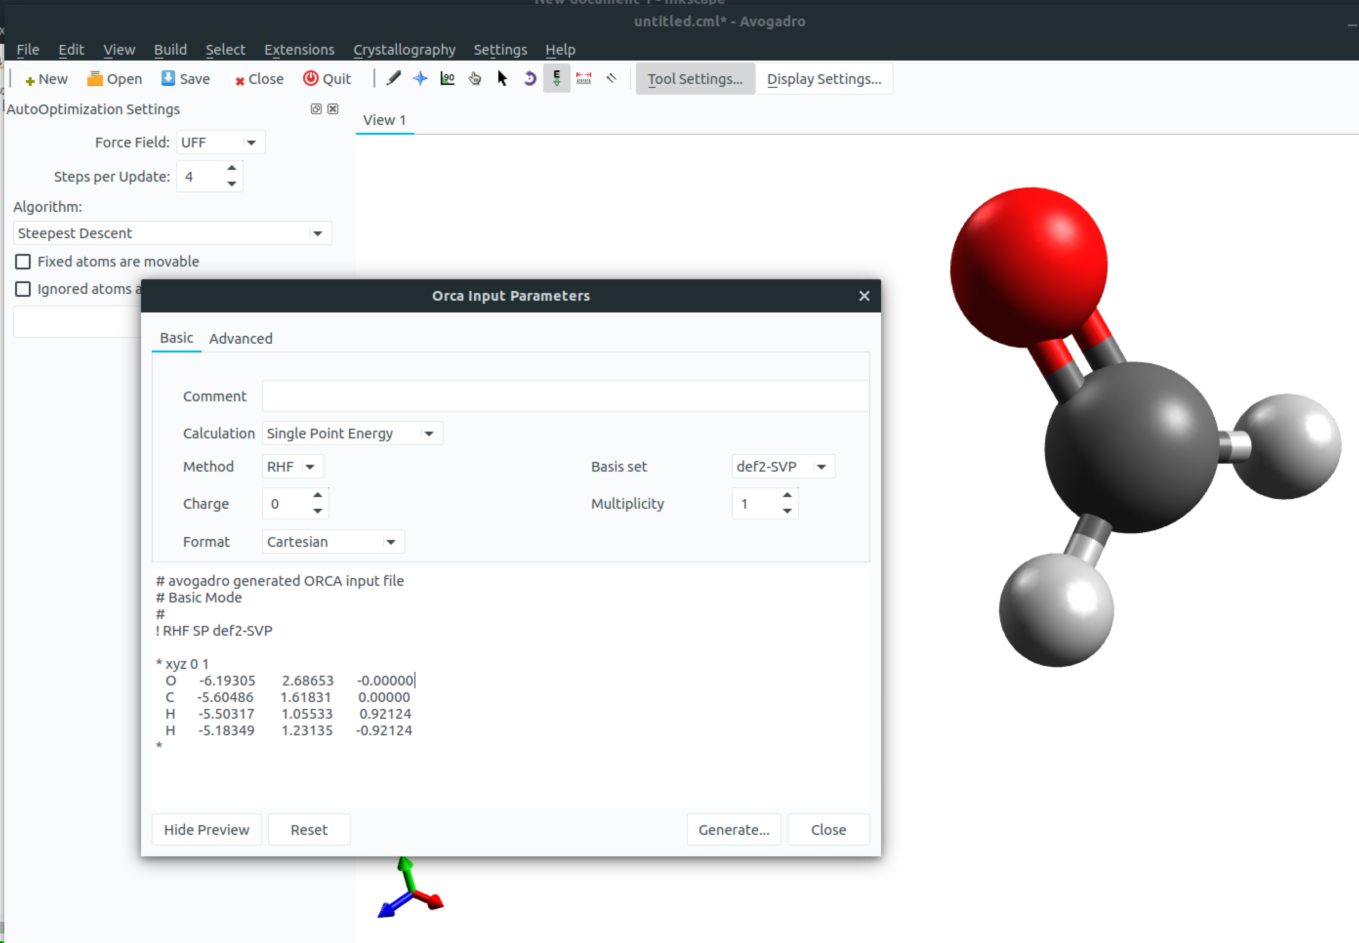
where you can choose the options you need and "Generate..." the input. If you want to generate orbital plots, you should add LARGEPRINT on the main input.
Visualizing output
Orbital plots
If you run a calculation using !LARGEPRINT on the main input and Save output to a file, you can visualize the orbitals by opening the basename.out file in Avogadro. Then select the orbital you want on the right panel to get something like
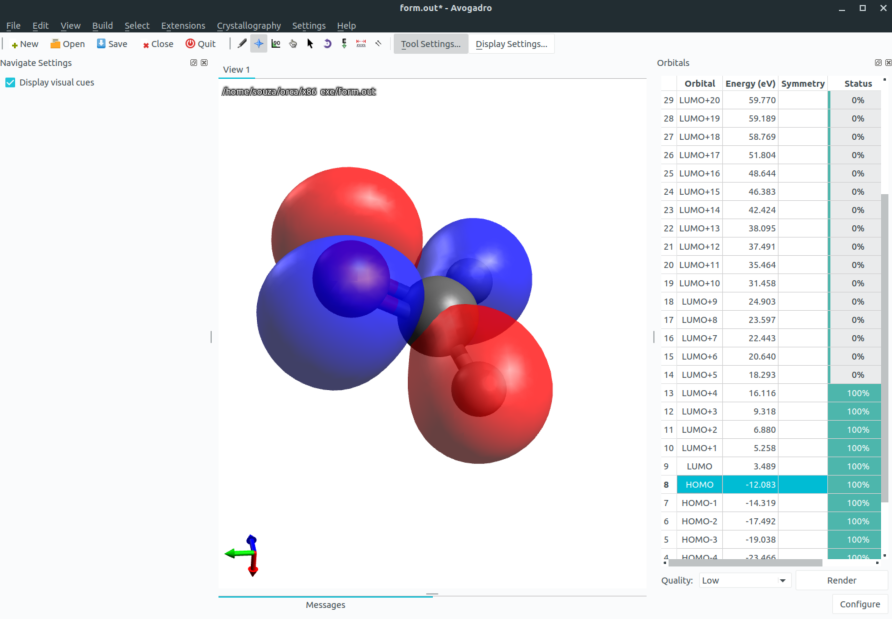
for the HOMO of formaldehyde. Higher quality images can be generated by changing the "Quality" option or on the "Configure" button next to it.
Hint
If the orbital image is not immediately available, click on "Render" to produce the image.
Density Plots
After loading an output file, you can also go to "Extensions" and click "Create Surfaces...". A new window will appear were you can select the "Surface Type" and "Color by" to make this density plots with the electrostatic potential on the surface:
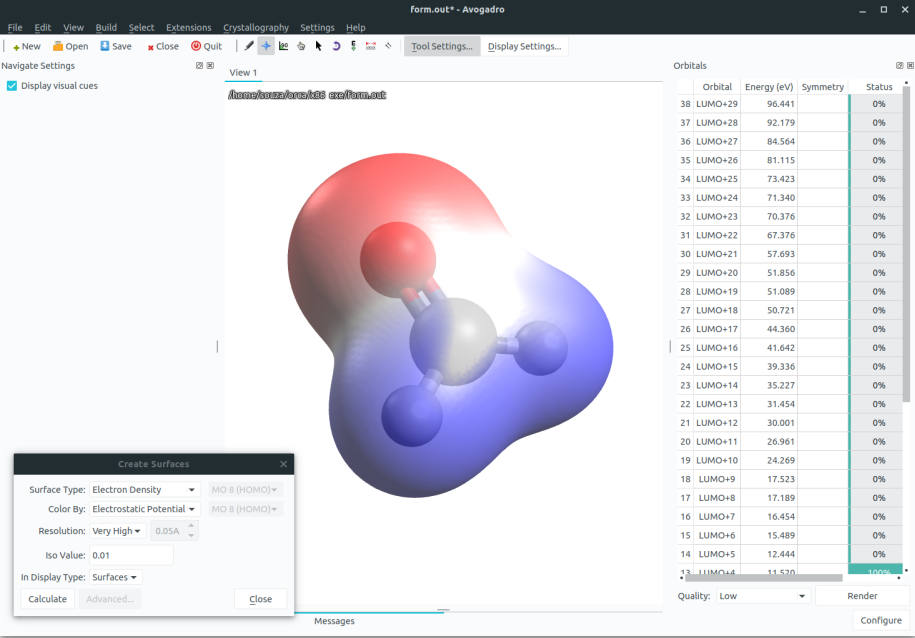
Here blue means positive charge and red negative charge. You can also change the resolution of these surfaces at will.
Vibrational modes and IR
In case your output has a frequency calculation on it (see Vibrational frequencies), the vibrational modes can be animated after loading the file and the vibrational spectra can be plotted by selecting "Plot Spectra":